There have been a lot of questions on this forum regarding the boost pressure for the various PROcede maps. So, to answer those questions I did 4 “third gear” datalogs using the 2-19(2009) 6MT Doomsday maps:
Stage 0 (Default User Torque = 90)
Stage 1 (Default User Torque = 90)
Stage 1 (User Torque = 80)
Valet Mode (Stock) [done on a different day]
The only modification to the car, besides a PROcede, is a downpipe-back exhaust (stock air filter). The test conditions were 91 octane, Temp = 55 F (50 F for Valet Mode), Altitude = 200 ft.
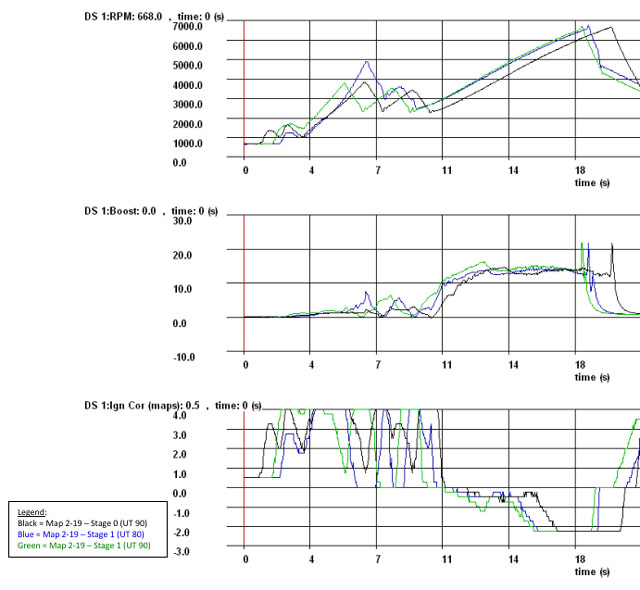
(1) Here is the raw data from the PROcede datalogging software with the first 3 overlayed:
(2) Here is Boost vs. RPM for Stage 0 Only:

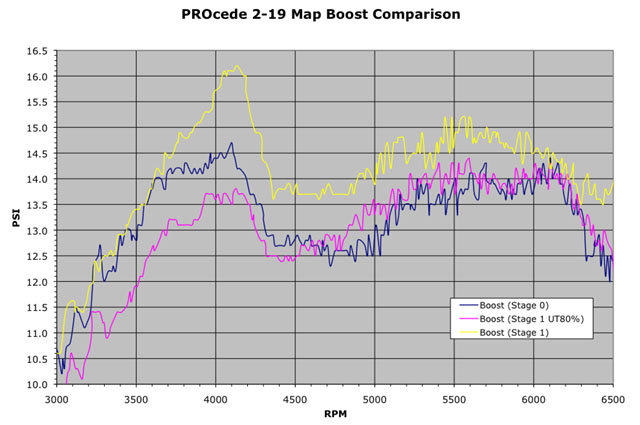
(3) Here is Boost vs. RPM for the first 3 overlayed:
(4) My boost pressure generalizations for Stage 0 are as follows (note: values adjusted 0.5 psi down to reflect a more true manifold pressure):
< 3000 RPM 9.0 – 10.0 psi
3000 – 4000 RPM 10.0 to 14.0 psi (Increase)
4000 – 4300 RPM 14.0 to 12.2 psi (Decrease Linearly)
**Boost is decreased due to valve timing phase shift at ~ 4200 RPM
4300 – 4900 RPM 12.2 psi (Constant)
4900 – 6100 RPM 12.2 to 13.7 psi (Increase)
6100 – 6500 RPM 13.7 to 11.7 psi (Decrease Linearly)
6500 – 7000 RPM Rapid Boost Taper
(5) Affects of UT Setting: Dropping the UT from 90 to 80 on Stage 1 has a significant impact on the boost pressure – much more than I thought it would have.
-------------------------------------------------------------------------------------------
(6) Here is Boost vs. RPM for Valet Mode (Stock):

(7) Here is Boost vs. RPM for Valet Mode (Stock) and Stage 0 Overlayed:

(8) Here is Boost vs. RPM for Valet Mode (Stock) and Stage 0 Overlayed on a Dual Axis [to better illustrate the differences/similarities in the boost curves]:

(9) Here is Boost vs. RPM Boost Increase for Stage 0 Over Stock [with a Trendline]:

(10) Stage 0 vs. Stock Boost Curve Analysis: The stock boost curve is obviously not flat (constant) and tailored to conditions just like the procede. The boost increase over stock graph (item 9) clearly shows the procede is very deliberate in the boost increase curve as illustrated by the trendline.
I hope this helps people understand the PROcede boost curves, the differences between maps, and the impact of user torque settings.