Hi Jules,
nice write up.
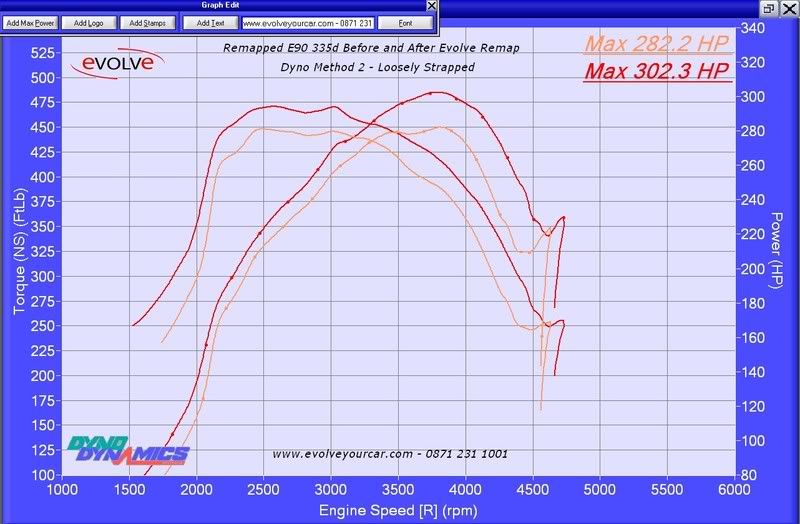
This is probably the first time any of you have seen 335d graphs with flywheel figures.
Normally you'll see wheel power vs wheel torque.
The reason this has been done is because we cannot show wheel torque without taking the software out of shoot out mode. This is just the way the new software is. When the dyno comes out of shootout mode we also lose the various different temperatures which are displayed on the graphs. Without these a Dyno Dynamics print out is worthless.
The exercise here was to see the difference in one map to another with the car setup up in exactly the same way.
We also tried a different setup strategy on the dyno which allowed the car to climb the front rollers a little. Again, the different in the curves was there but the difference was slightly more.
The graphs that Jules has posted are those where the car is strapped ito the dyno quite hard and not allowing any movement on the dyno.
When the cars are strapped like this the power/torque does not drop off dramatically after approx 4000rpm.
If the car is allowed to even climb the front rollers slightly then the power/torque drops off dramatically.
I should point out there is no inbetween either.
We had a look at how the cars were run on the Surrey Rolling Road dyno day and we can see that the power drops off at approx 4000-4500rpm on all of the graphs. The cars are being allowed to climb slightly.
Jules's car made 282bhp at the wheels with this second method....which is pretty much the same as what other cars with the same map made on the Surrey Rolling Road graph with the same shape of graph.
With the car setup in the exact same way, with our map it made 302bhp at the wheels.
When Jules says we learnt something he wasn't wrong!
We personally felt that these cars need to be strapped down hard as it gave what we thought was a more realistic (lower) figure and smoother and more realistic graphs which reflects the true natural power delivery of this engine.
The simple fact is that these engines do not fall off in power over 4000rpm in the real world.
This is backed up by Hartge's own dyno graphs (who's remaps we also supply) they also are consistent with the first method of strapping where power does not dramatically fall.
Therefore, please find below the graphs of Jules's car dynoed in the same way as Surrey Rolling Road and this time with power at the wheels vs torque at the wheels. We've done this just to give you something to compare with on the same playing field.
Do not give too much attention the torque 'figures'. The torque is a calculation of BHP and rpm's. If the rpm's are even slightly different to actual then this affects the torque quite alot.
The main point of the exercise was to see the difference of two maps with the car setup in exactly the same way.